연초에 새웠던 계획 중 하나인 사이드 프로젝트를 좋은 팀원들을 만나 하게 되면서 Flutter에 입문하게 되었다.
퇴근 후 진행되는 회의와 해야하는 작업들은 종종 압박이 되긴 했지만, 서비스 개발부터 배포까지 직접 해보는 게
재미있어서 열심히 진행중이다.
인스타 챌린지와 함께 진행되는 만큼 마켓 반응도 있으며 글을 작성할 당시 구글 스토어 다운로드 수 500+ 앱 스토어 다운로드수 1000+ 을 달성하며 나름 순항하고 있다.
❤️ SNAPBODY 많이 사랑해 주세요 ❤️
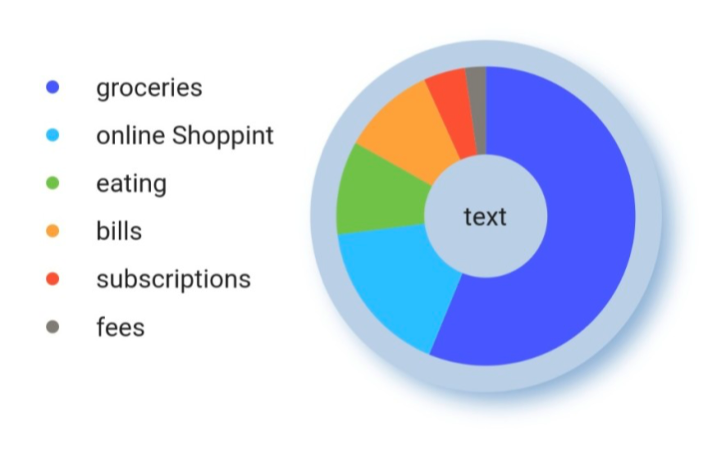
이번 글은 주제는 SNAPBODY의 신규 기능이자 혼자 개발을 맡은 통계 부분 중 도넛 차트 (원형 그래프)를 구현하는 방법이다.
Flutter 에는 그래프 관련 멋진 라이브러리들이 많지만 우리 서비스에 필요한 도넛 차트를 그리는데 적합한 라이브러리를 찾지 못하여 Custom Paint를 이용하여 구현하는 방법밖에 없었는데,
우연히 발견한 인도 천재 개발자가 알려준 방법을 토대로 간단한 팁들과 최신 버전에서 (2.18 ~ 3.0) 어떻게 적용하는지 그 과정을 작성해 보려고 한다.
전체 코드만 궁금하다면 우측 목차 전체 코드 부분을 클릭하면 더 빠르게 확인할 수 있다.
그래프 영역 설정하기
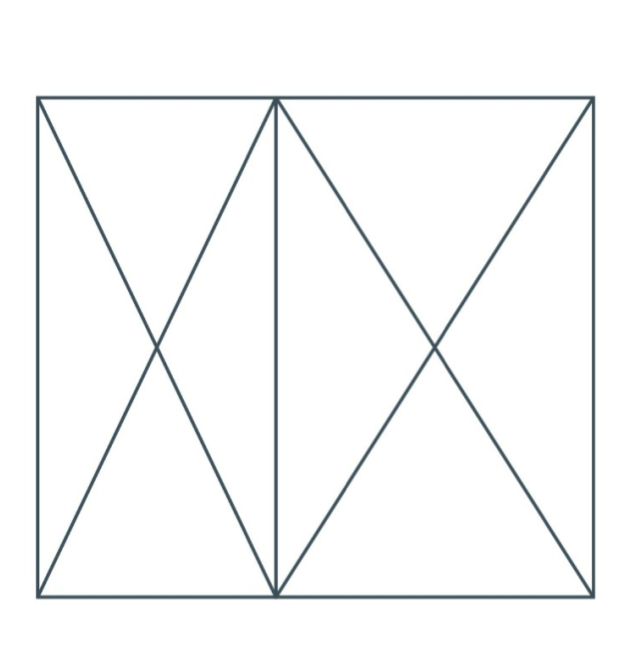
그래프를 그릴 때 팁은 Placeholder() 위젯을 사용하면 화면에 그릴 부분의 크기를 미리 확인할 수 있다.
때문에 이번에도 Placeholder 위젯을 이용하여 화면에 그래프가 들어갈 위치를 먼저 잡아준다.
// @NOTE: main.dart

@override
  Widget build(BuildContext context) {
    return const SingleChildScrollView(
        child: Column(
      children: [
        SizedBox(
          height: 50,
        ),
        SizedBox(
          height: 400,
          child: Padding(
            padding: EdgeInsets.symmetric(horizontal: 25.0),
            child: Column(
              crossAxisAlignment: CrossAxisAlignment.start,
              children: [
                SizedBox(
                  height: 100,
                ),
                Expanded(child: Placeholder())
              ],
            ),
          ),
        )
      ],
    ));
  }
그다음 데이터 라벨 (앞으로 category 영역이라 부르겠다) 영역과 그래프 영역으로 미리 위젯을 분리해 준다
SizedBox(
          height: 400,
          child: Padding(
            padding: EdgeInsets.symmetric(horizontal: 25.0),
            child: Column(
              crossAxisAlignment: CrossAxisAlignment.start,
              children: [
                SizedBox(
                  height: 100,
                ),
                Expanded(
                    child: Row(
                  children: [
                    Expanded(flex: 3, child: Placeholder()),
                    Expanded(flex: 4, child: Placeholder()),
                  ],
                ))
              ],
            ),
          ),
        )
분리한 영역을 CategoriesRow() 위젯과 PieChartView() 위젯으로 분리해 준다.
SizedBox(
          height: 400,
          child: Padding(
            padding: EdgeInsets.symmetric(horizontal: 25.0),
            child: Column(
              crossAxisAlignment: CrossAxisAlignment.start,
              children: [
                SizedBox(
                  height: 100,
                ),
                Expanded(
                    child: Row(
                  children: [
                    CategoriesRow(),
                    PieChartView(),
                  ],
                ))
              ],
            ),
          ),
        )
PieChart 영역 구현하기
도넛 형태의 pie chart를 구현하기 위해 우선 바깥 원 역할을 할 큰 원을 구현한다.
// @NOTE: pie_chart_view.dart

import 'package:flutter/material.dart';

class PieChartView extends StatelessWidget {
  const PieChartView({super.key});

  @override
  Widget build(BuildContext context) {
    return Expanded(
        flex: 4,
        child: LayoutBuilder(
          builder: (context, constraint) => Container(
              decoration: const BoxDecoration(
                  color: Color.fromRGBO(193, 214, 233, 1),
                  shape: BoxShape.circle,
                  boxShadow: [
                BoxShadow(
                  spreadRadius: -10,
                  blurRadius: 17,
                  offset: Offset(-5, -5),
                  color: Colors.white,
                ),
                BoxShadow(
                    spreadRadius: -2,
                    blurRadius: 10,
                    offset: Offset(7, 7),
                    color: Color.fromRGBO(
                      146,
                      182,
                      216,
                      1,
                    ))
              ])),
        ));
  }
}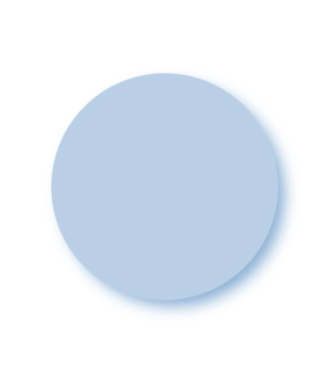
그리고 우리는 Stack widget과 CustomPaint를 이용하여 바깥원 위에 작은 원을 그릴 것이다.
우선 그래프에서 사용할 데이터 형식을 정의하자
여기서 받을 데이터는 데이터 이름(name)과 데이터의 크기 (amount) 이렇게 2가지가 될 것이며 이것을 Category 클래스로 정의할 것이다.
추가적으로 임시 데이터를 kCategories로 미리 준비해 두자
class Category {
  Category(this.name, {required this.amount});

  final String name;
  final double amount;
}

final kCategories = [
  Category('groceries', amount: 500.00),
  Category('online Shoppint', amount: 150.00),
  Category('eating', amount: 90.00),
  Category('bills', amount: 90.00),
  Category('subscriptions', amount: 40.00),
  Category('fees', amount: 20.00),
];
여기에 그래프에 사용할 색상 또한 미리 준비해 둔다.
final kNeumorphicColors = [
  const Color.fromRGBO(82, 98, 255, 1),
  const Color.fromRGBO(46, 198, 255, 1),
  const Color.fromRGBO(123, 201, 82, 1),
  const Color.fromRGBO(255, 171, 67, 1),
  const Color.fromRGBO(252, 91, 57, 1),
  const Color.fromRGBO(139, 135, 130, 1),
];
이제 작은 원 역할을 할 pie_chart 위젯을 구현해 주자
이 위젯은 pie_chart_view 하위에 들어갈 것이며 파라미터로
List 형식의 categories와 double 타입의 width을 인자값으로 받을 것이다.
우리는 이 파라미터를 이용하여 그래프의 전체적인 크기 밑 안쪽 원 크기를 조절할 것이다.
    Offset center = Offset(size.width / 2, size.height / 2);
    double radius = min(size.width / 2, size.height / 2);

    var paint = Paint()
      ..style = PaintingStyle.stroke
      ..strokeWidth = width / 2;
또한 그래프의 총 크기 (amount)의 값을 반복문으로 구하고, paint의 시작 위치를 원 가운데에 위치하도록 정의해 준다.
double total = 0;
    for (var element in categories) {
      total += element.amount;
    }

    double startRadian = -pi / 2;
그 후 반복문을 이용해 canvas에 그래프를 그려주면 된다.
for (var index = 0; index < categories.length; index++) {
      final currentCategory = categories.elementAt(index);
      final sweepRadian = currentCategory.amount / total * 2 * pi;
      paint.color = kNeumorphicColors.elementAt(index % categories.length);

      canvas.drawArc(
        Rect.fromCircle(center: center, radius: radius),
        startRadian,
        sweepRadian,
        false,
        paint,
      );
      startRadian += sweepRadian;
    }
이후 pie_chart_view에 방금 만든 pie_chart를 연결하고 아래 위치에 Text 위젯을 추가하면 그래프 작은 원 안에 text를 삽입할 수 있다.
child: Stack(
              children: [
                Center(
                  child: SizedBox(
                    width: constraint.maxWidth * 0.6,
                    child: CustomPaint(
                      foregroundPainter: PieChart(
                          width: constraint.maxWidth * 0.5,
                          categories: kCategories),
                      child: const Center(
                        child: Text('text'),
                      ),
                    ),
                  ),
                )
              ],
            ),
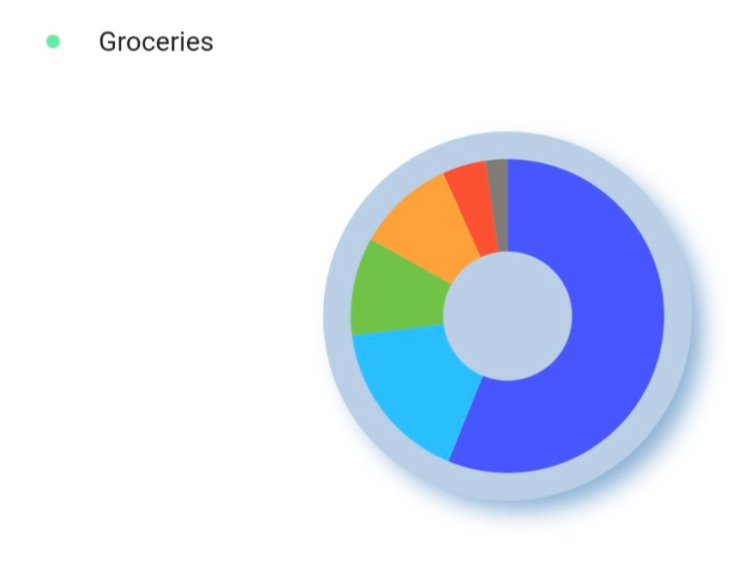
CategoriesRow 영역 구현하기
이제 category 영역으로 가보자
우선 각 항목마다 색상을 표현할 수 있는 점을 Container의 BoxDecoration 속성을 이용하여 만들어주고
Text 영역 또한 구현해 준다.
// @NOTE: categoriew_row.dart

import 'package:flutter/material.dart';

class CategoriesRow extends StatelessWidget {
  const CategoriesRow({super.key});

  @override
  Widget build(BuildContext context) {
    return Expanded(
        flex: 3,
        child: Column(
          children: [
            Row(
              children: [
                Container(
                  width: 7,
                  height: 7,
                  decoration: const BoxDecoration(
                    shape: BoxShape.circle,
                    color: Colors.greenAccent,
                  ),
                ),
                const SizedBox(
                  width: 20,
                ),
                const Text('Groceries'),
              ],
            )
          ],
        ));
  }
}
이때 categoriew_row에서 반복을 줄이기 위해 Text가 들어간 Row 부분을 ExpenseCategory로 분리하고
text와 index라는 두 파라미터에 데이터를 내려주도록 하자
class CategoriesRow extends StatelessWidget {
  const CategoriesRow({super.key});

  @override
  Widget build(BuildContext context) {
    return Expanded(
        flex: 3,
        child: Column(
          mainAxisAlignment: MainAxisAlignment.center,
          children: [
            for (var category in kCategories)
              ExpenseCategory(
                  text: category.name, index: kCategories.indexOf(category))
          ],
        ));
  }
}
이후 반복문 안에 들어갈 아까 분리한 ExpenseCategory안에 파라미터로 받는 index값과 text 값을 연결해 주면 끝!
class ExpenseCategory extends StatelessWidget {
  const ExpenseCategory({
    super.key,
    required this.index,
    required this.text,
  });

  final int index;
  final String text;

  @override
  Widget build(BuildContext context) {
    return Padding(
      padding: const EdgeInsets.only(bottom: 10),
      child: Row(
        children: [
          Container(
            width: 7,
            height: 7,
            decoration: BoxDecoration(
              shape: BoxShape.circle,
              color:
                  kNeumorphicColors.elementAt(index % kNeumorphicColors.length),
            ),
          ),
          const SizedBox(
            width: 20,
          ),
          Text(text),
        ],
      ),
    );
  }
}
전체 코드
import 'package:flutter/material.dart';
import 'pie_chart_view.dart';
import 'categories_row.dart';

class Main extends StatelessWidget {
  const Main({super.key});

  @override
  Widget build(BuildContext context) {
    return const SingleChildScrollView(
        child: Column(
      children: [
        SizedBox(
          height: 400,
          child: Padding(
            padding: EdgeInsets.symmetric(horizontal: 25.0),
            child: Column(
              crossAxisAlignment: CrossAxisAlignment.start,
              children: [
                SizedBox(
                  height: 100,
                ),
                Expanded(
                    child: Row(
                  children: [
                    CategoriesRow(),
                    PieChartView(),
                  ],
                ))
              ],
            ),
          ),
        )
      ],
    ));
  }
}
import 'package:flutter/material.dart';
import 'package:pie_chart.dart';
class PieChartView extends StatelessWidget {
const PieChartView({super.key});
@override
Widget build(BuildContext context) {
return Expanded(
flex: 4,
child: LayoutBuilder(
builder: (context, constraint) => Container(
decoration: const BoxDecoration(
color: Color.fromRGBO(193, 214, 233, 1),
shape: BoxShape.circle,
boxShadow: [
BoxShadow(
spreadRadius: -10,
blurRadius: 17,
offset: Offset(-5, -5),
color: Colors.white,
),
BoxShadow(
spreadRadius: -2,
blurRadius: 10,
offset: Offset(7, 7),
color: Color.fromRGBO(
146,
182,
216,
1,
))
]),
child: Stack(
children: [
Center(
child: SizedBox(
width: constraint.maxWidth * 0.6,
child: CustomPaint(
foregroundPainter: PieChart(
width: constraint.maxWidth * 0.5,
categories: kCategories),
child: const Center(
child: Text('text'),
),
),
),
)
],
),
),
));
}
}import 'package:flutter/material.dart';
import 'dart:math';
class PieChart extends CustomPainter {
PieChart({required this.categories, required this.width});
final List<Category> categories;
final double width;
@override
void paint(Canvas canvas, Size size) {
Offset center = Offset(size.width / 2, size.height / 2);
double radius = min(size.width / 2, size.height / 2);
var paint = Paint()
..style = PaintingStyle.stroke
..strokeWidth = width / 2;
double total = 0;
for (var element in categories) {
total += element.amount;
}
double startRadian = -pi / 2;
for (var index = 0; index < categories.length; index++) {
final currentCategory = categories.elementAt(index);
final sweepRadian = currentCategory.amount / total * 2 * pi;
paint.color = kNeumorphicColors.elementAt(index % categories.length);
canvas.drawArc(
Rect.fromCircle(center: center, radius: radius),
startRadian,
sweepRadian,
false,
paint,
);
startRadian += sweepRadian;
}
}
@override
bool shouldRepaint(CustomPainter oldDelegate) => true;
}
class Category {
Category(this.name, {required this.amount});
final String name;
final double amount;
}
final kCategories = [
Category('groceries', amount: 500.00),
Category('online Shoppint', amount: 150.00),
Category('eating', amount: 90.00),
Category('bills', amount: 90.00),
Category('subscriptions', amount: 40.00),
Category('fees', amount: 20.00),
];
final kNeumorphicColors = [
const Color.fromRGBO(82, 98, 255, 1),
const Color.fromRGBO(46, 198, 255, 1),
const Color.fromRGBO(123, 201, 82, 1),
const Color.fromRGBO(255, 171, 67, 1),
const Color.fromRGBO(252, 91, 57, 1),
const Color.fromRGBO(139, 135, 130, 1),
];import 'package:flutter/material.dart';
import 'package:snapbody_v2/app/stat/page/pie_chart.dart';
class CategoriesRow extends StatelessWidget {
const CategoriesRow({super.key});
@override
Widget build(BuildContext context) {
return Expanded(
flex: 3,
child: Column(
mainAxisAlignment: MainAxisAlignment.center,
children: [
for (var category in kCategories)
ExpenseCategory(
text: category.name, index: kCategories.indexOf(category))
],
));
}
}
class ExpenseCategory extends StatelessWidget {
const ExpenseCategory({
super.key,
required this.index,
required this.text,
});
final int index;
final String text;
@override
Widget build(BuildContext context) {
return Padding(
padding: const EdgeInsets.only(bottom: 10),
child: Row(
children: [
Container(
width: 7,
height: 7,
decoration: BoxDecoration(
shape: BoxShape.circle,
color:
kNeumorphicColors.elementAt(index % kNeumorphicColors.length),
),
),
const SizedBox(
width: 20,
),
Text(text),
],
),
);
}
}참고 링크
https://www.youtube.com/watch?v=rkOc8WbgPqw
'Flutter' 카테고리의 다른 글
| photo_manager, Error: Type 'DecoderCallback' not found 해결 (부제: flutter SDK 직접 다운로드 및 경로 설정하기) (0) | 2023.12.30 |
|---|---|
| [Flutter] Flutter 개발을 위한 Dart 문법 총정리 - 2 (0) | 2023.08.01 |
| [Flutter] Flutter 개발을 위한 Dart 문법 총정리 - 1 (0) | 2023.07.30 |